If you are reading this article, I guess you already went over
part 1 which addressed the main issues about Memory. In part 1, we have mostly seen how memory reacts in a virtual environment. We should not confuse virtual memory in virtualization and virtual memory systems between physical memory and virtual addresses. It's completely two different things. To clarify this part, we need to understand that in Linux we have physical to virtual page mapping. This occurs within an OS itself.
 RES vs VIRT vs SHR
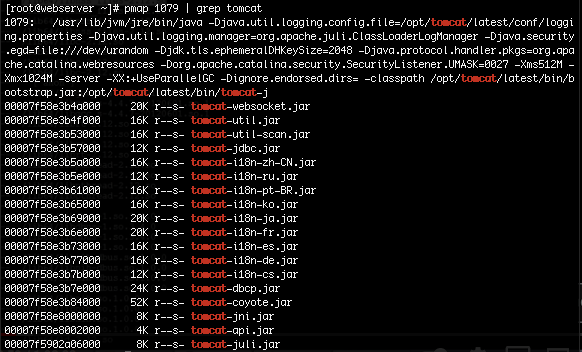
In the previous post, we learned that to see how much swap in and swap out is occurring is retrieved using the command 'vmstat' and to know which process might be the candidate of being eliminated by the OOM killer is retrieved using the command dstat. However, there is another command 'pmap' which can be used to see the physical and virtual memory mapping.
Here is an example of how I retrieved where Tomcat which is running by a PID 1079 is residing. On the right is where the file reside which is the physical address and on the left is the virtual address.
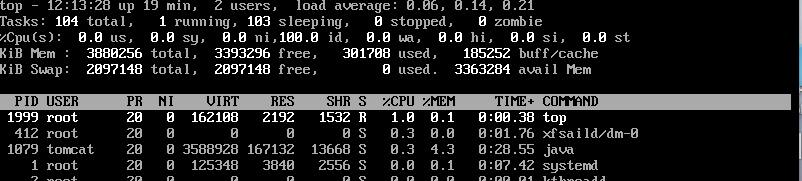
Let's now get into some basics of virtual memory. It is simply a representation or extraction from the physical memory!. So, how do we know how much memory a process is consuming which is in the virtual address space and the physical space? To answer this. you will have to launch the 'top' command. You will see the column 'RES' which means resident: how much physical memory is being used and 'VIRT' which means virtual: how much memory has been mapped in the virtual address space. 'SHR' which stands for shared is how much shared memory is being used. The difference between 'SHR' and 'VIRT': 'VIRT' is how much memory the process can access and 'SHR' is how much memory is being accessed.
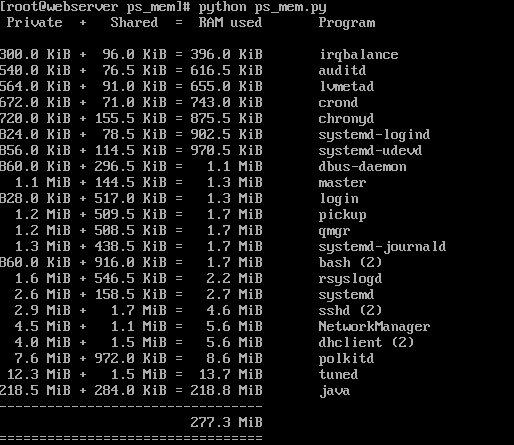
If ever you are thinking about making the sum of the RES will never be equivalent to the physical memory, because we are making the sum by process, and it's wrong. Remember pmap!.. physical to virtual mapping! two processes can share the same library. That is why when you add the total RES, it's always greater than the actual physical memory size of the machine. I found
a script on Github which I forked to my repo and that script can report how much RAM is used by the process.
 The /proc/meminfo
The
/proc/meminfo reports current memory usage on your system along with some other information about the memory. However, it depends which OS you are using. Assuming its a RedHat distribution, for instance in Rhel7, MemAvailable has been introduced.
This link is very useful to understand all the parameters introduced in RHEL environment. Also good to know that the commands
free and
vmstat all get its information from
/proc/meminfo.
Some helpful vmstat and free commands:
- free -b -- Memory in Bytes
- free -m -- Memory in MegaBytes
- free -g -- Memory in GigaBytes
- free -k -- Memory in KiloBytes (Which is the default one)
- free -h -- Human readable format (Unit of measurement is to the nearest MegaBytes)
- free -w - Shows the buffers(Metadata about data) and cache(actual data) separately (Intensive memory troubleshooting, would be very important)
- free -c Should be use with -s -- c for count and s for seconds -- It simply counts (Good to capture information within seconds)
- free -l -- Shows low and high value ( Intensive troubleshooting if you actually doubt how memory is used).
- vmstat -s -- Shows buffer memory statistics as well as more details(CPU pagein, pageout, etc.)
- vmstat -a -- Shows in and active memory
- vmstat -f -- How much forks,vfork and clone are done since boot. Example if java process is creating new threads each time (clone), that should be seen increasing.
- vmstat -m -- Display slab info - The Linux kernel should support slabinfo for this to work. The data comes from /proc/slabinfo. When memory is being allocated and deallocated, its done through a special cache called slabs. From there we can see which slab is using how much pages and its respective size.
- vmstat -n -- Display header only at once. - useful to combine with other arguments to prevent repetition.
Tuning your kernel
You can also tune your kernel. There are several parameter from
sysctl -a which involves memory. This
link from RedHat provide another good piece of information about virtual memory parameter. However, to get a good documentation about a specific parameter you can install the kernel-doc module using a simple yum install kernel-doc and after installation the documents will be available at
/usr/share/doc/kernel-doc-xxx/Documentation/sysctl/vm.txt. Some parameters are for OOM killer,
Dirty_expire_centisecs which can be tweaked to change how long the dirty pages can be flushed out.
Part 3 will focus more on CPU and CPU caching and other various parameter. Feel free to search other related memory article from this blog to compliment this article.
