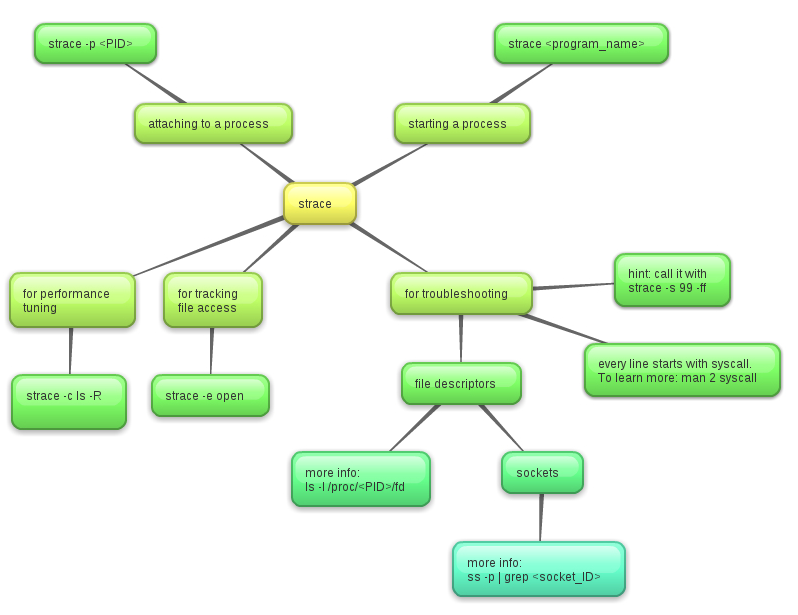
A quick look at the manual of Strace would show you an indication that the strace command is used to trace system calls and signals. The desciption part stipulates that "In the simplest case strace runs the specified command until it exits. It intercepts and records the system calls which are called by a process and the signals which are received by a process. The name of each system call, its arguments and its return value are printed on standard error or to the file specified with the -o option."
[google_ad data_ad_slot='' data_ad_format='rectangle'] [caption id="attachment_1189" align="aligncenter" width="798"]
However, there are much more than that to discover. Since strace uses ptrace which observe and control execution of another process and examination of memory and registers. In some way, strace can be dangerous because signal injection and suppression may occur. The debugging mechanism is dangerous as it pause the target process for syscalls to read the state - ptrace(PTRACE_restart, pid, 0, sig)
Proof of concept strace can be dangerous
From the example below we can see the time taken copied is much slower compared with a strace.
[root@ansible1 ~]# dd if=/dev/zero of=/dev/null bs=1 count=600k 614400+0 records in 614400+0 records out 614400 bytes (614 kB) copied, 0.38371 s, 1.
[root@ansible1 ~]# strace -eaccept dd if=/dev/zero of=/dev/null bs=1 count=600k 614400+0 records in 614400+0 records out 614400 bytes (614 kB) copied, 16.9985 s, 36.1 kB/s +++ exited with 0 +++ 6 MB/s
The 12 main syscalls
There are 12 main syscalls worth learning to grasp output of strace
| Syscall | Description |
| read | read bytes from a file descriptor (file and socket) |
| write | write bytes from a file descriptor (file and socket) |
| open | open a file (returns a descriptor) |
| close | close the file descriptor |
| fork | create a new process (current process is forked) |
| exec | execute a new program |
| connect | connect to a network host |
| accept | accept a network connection |
| stat | read files statistics |
| ioctl | set IO properties and other functions |
| mmap | map a file to the process memory address space |
| brk | extend the heap pointer |
Strace output analysis
I will now take a strace example. I have created a file test in /tmp. You can check out the strace ouput at this link http://pastebin.com/zziCAwDz. Let's analyse it.
We can noticed the following at the beginning
-
execve("/bin/ls", ["ls", "-l", "/etc"], [/* 22 vars */]) = 0
-
brk(0) = 0x8ca8000
-
mmap2(NULL, 4096, PROT_READ|PROT_WRITE, MAP_PRIVATE|MAP_ANONYMOUS, -1, 0) = 0xb7791000
-
access("/etc/ld.so.preload", R_OK) = -1 ENOENT (No such file or directory)
-
open("/etc/ld.so.cache", O_RDONLY) = 3
-
fstat64(3, {st_mode=S_IFREG|0644, st_size=25200, ...}) = 0
-
mmap2(NULL, 25200, PROT_READ, MAP_PRIVATE, 3, 0) = 0xb778a000
The execve() variant is running /bin/ls then libraries are called in the variant followed by several libraries from /lib directory. After the file descriptor is close with the close() function, you will noticed at line 10 there is a open("/etc/ld.so.cache", O_RDONLY) = 3 which means that whilst opening the /etc it has returned a value 3, a file descriptor for later use with other syscalls.
You will noticed that the content of /etc is being read, then for each file inside /etc it calls lstat() vand stat() variant. Two extended attribute varients are also called that are lgetxattr() and getxattr() and finally ls -l start printing out the results. But hey! Did you noticed that ls is running /etc/localtime on every output? stat64("/etc/localtime", {st_mode=S_IFREG|0644, st_size=239, ...}) = 0 is being called each time!
Some strace commands
#Slow the target command and print details for each syscall: strace command
[google_ad data_ad_slot='' data_ad_format='rectangle']$Slow the target PID and print details for each syscall: strace -p PID
# Slow the target PID and any newly created child process, printing syscall details: strace -fp PID
# Slow the target PID and record syscalls, printing a summary: strace -cp PID
# Slow the target PID and trace open() syscalls only: strace -eopen -p PID
# Slow the target PID and trace open() and stat() syscalls only: strace -eopen,stat -p PID
# Slow the target PID and trace connect() and accept() syscalls only: strace -econnect,accept -p PID
# Slow the target command and see what other programs it launches (slow them too!): strace -qfeexecve command
# Slow the target PID and print time-since-epoch with (distorted) microsecond resolution: strace -ttt -p PID
# Slow the target PID and print syscall durations with (distorted) microsecond resolution: strace -T -p PID
From what we can understand is that if /etc/localtime is being run each time, it is consuming more resource and heavily interrupting the system. So, strace is based on rather simple syscalls, however, it can also cause heavy performance overhead.
I have created a new tag called Linux Performance. This article does not give a clear overview of strace in itself. Some more articles coming later on Linux performance, analysis and tuning.
