
As promised on Twitter days back, I would post some interesting tips and tricks using the SAR (System Activity Report) linux command. The sar command writes to standard output the contents of selected cumulative activity counters in the operating system. The accounting system, based on the values in the count and interval parameters, writes information the specified number of times spaced at the specified intervals in seconds. If the interval parameter is set to zero, the sar command displays the average statistics for the time since the system was started. - die.net
[google_ad data_ad_slot='' data_ad_format='rectangle']Understanding SAR and its main configuration files
The SAR command is part of the sysstat package which is a multi-purpose analysis tool and it is useful to pin point specific issue related to CPU, Memory, I/O and Network. The command is really useful especially to plot the output on a graph for visual analysis and reporting. One example of such tool is GNUplot. To install GNUplot and SAR use the command yum install sysstat gnuplot. The configuration file of SAR is located at /etc/cron.d/sysstat and /etc/sysconfig/sysstat . If you would perform a rpm -ql sysstat | less , you would noticed that there are other binaries such as iostat,mpstat,pidstat etc.. that comes along with the package sysstat.

Difference between SA and SAR logs
In the directory /etc/cron.d/sysstat you would noticed that there is a cron which have been set up by default to run every ten minutes. The purpose is to write a log in the directory /var/log/sa . In this directory there are two type of files starting with sa and sar. SAR is the text file while SA is a binary. The sa file - Binary is updated every 10 minutes whereas the sar file is written at the end of the day. This parameter have been configured in the cron itself. By using the file command you would know which one is a binary or a text file.

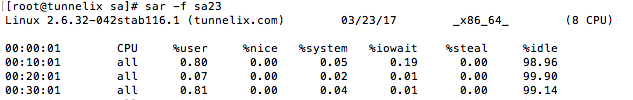
To open the sa file, you need to use the command sar -f . Here is an example:
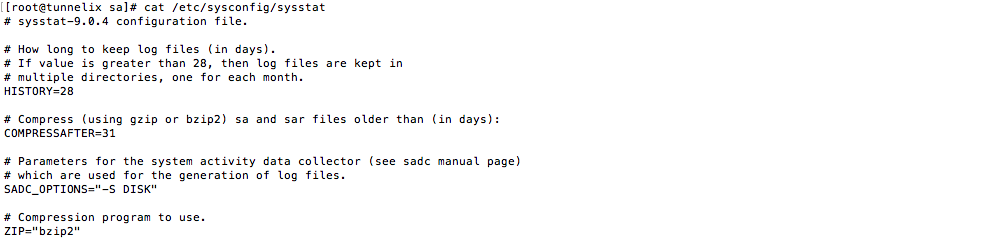
The /etc/sysconfig/sysstat file allows you to configure how long you want to keep the log, compression etc..
Some ways to use the SAR command
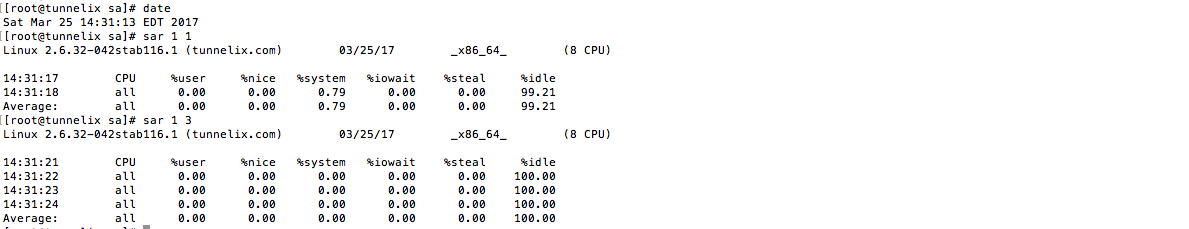
You can also visualize sar logs live using the sar command with the start and ending second. Let's say you have run a command on the background or simply want to track the resource status for some seconds, you can use the command sar 1 3 Here is an example with the command
sar 1 3
Checking the load average, we apply the same principle but with the following command. The load average will also include load on each processor.
sar -q 1 3
To check for memory being consumed per seconds, use the following command
sar -r 1 3
To check number of memory coming in and out of the swap space, use the following command
sar -W 1 3
For the Disk I/O read write per seconds use the following command. Read/Write on disk also depend on the hardware
sar -b 1 3
For info about the CPU use the following
sar -u 1 3
To monitor the network activity in terms of packets in and out per interface received and compressed, use the following command
sar -n DEV 1 3
If the sar file has not been generated yet from the binary, you can use the following command, let's say to convert it to a text in the /tmp directory.
sar -A -f sa25 > /tmp/sar25
KSAR Graph with SAR logs
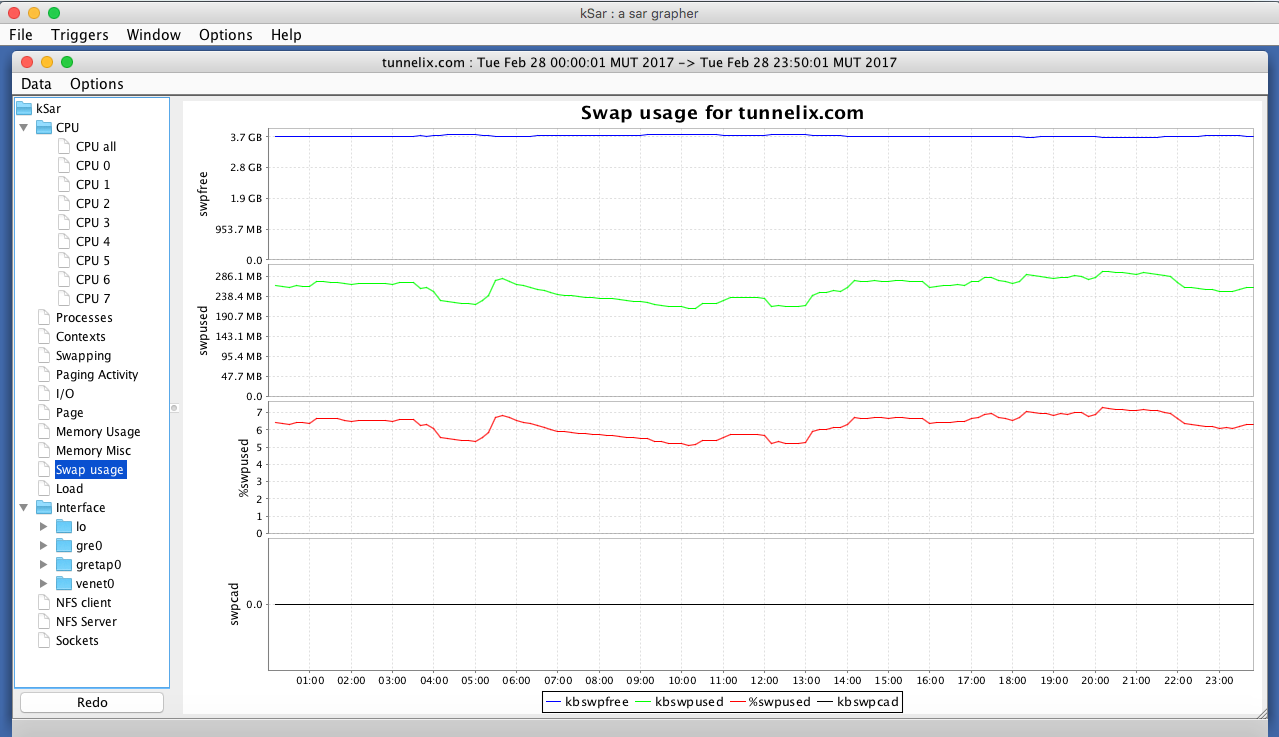
Now, in production environment, you need to to analyze for example at a specific time where memory or CPU was high. This can be done by means of a graph. I use the Ksar program. Ksar is a BSD-Licensed JAVA based application which create graph based on sar logs. You will need to install JAVA Runtime and launch the run.sh script to install the Ksar program. Once downloaded, just click on 'Data' and 'Load from text file'. This is an example of swap usage
TIPS:
- The SAR output by default is in 12 hour clock format. To make it become a 24 hour clock format edit the .bashrc file and insert the parameter alias sar="LANG=C sar"
- GNUPlot is one another application to plot your information on a graph for better analysis.