
blktrace is a block layer IO tracing mechanism which provides detailed information about request queue operations up to user space. There are three major components: a kernel component, a utility to record the i/o trace information for the kernel to user space, and utilities to analyse and view the trace information. This man page describes blktrace, which records the i/o event trace information for a specific block device to a file.
[caption id="attachment_2554" align="aligncenter" width="1130"]
Limitations and Solutions with blktrace
There are several limitations and solutions when using blktrace. We will focus mainly on its goal and how the blktrace tool can help us in our day to day task. Assuming that you want to debug any IO related issue, the first command will be probably an iostat. These utilities can be installed through a yum install sysstat blktrace. For example:
iostat -tkx -p 1 2
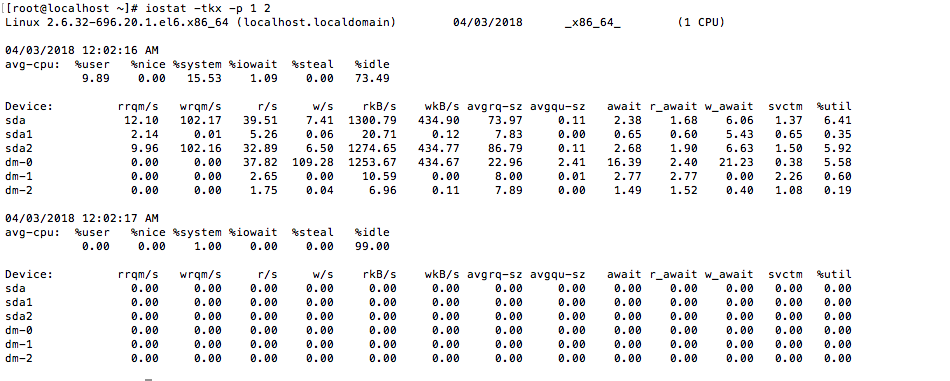
The limitation here with iostat is that it does not gave us which process is utilising which IO. To resolve this issue, we can use another utility such as iotop. Here is an example of the iotop output.

blktrace, iotop, blkparse, btt and btrace
Here iotop shows us exactly which process is consuming 'which' and 'how' much IO. But another problem with that solution is that it does not give detailed information. So, blktrace comes handy as it gives layer-wise information. How it does that? It sees what is going on exactly inside block I/O layer. When used correctly, it's possible to generate events for all I/O request and monitor it from where it is evolving. Though it extracts data from the kernel, it is not an analysis tool and the interpretation of the data need to be carried out by you. However, you can feed the data to btt or blkparse to get the analysis done.
Before looking at blktrace, let's check out the I/O architecture. Basically, at the userspace the user will write and read data. This is what the User Process at the user space. The user do not write directly to the disk. They first write to the VFS Page Cache and from which there are various I/O Scheduler and the Device Driver will interact with the disk to write the data.
[caption id="attachment_2558" align="aligncenter" width="767"]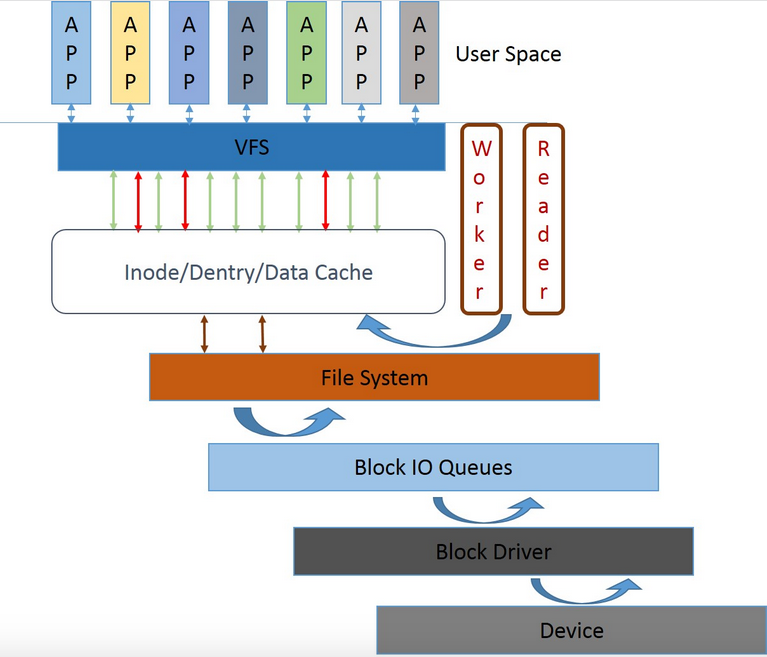
The blktrace will normally capture events during the process. Here is a cheat sheet to understand blktrace event capture.
[caption id="attachment_2559" align="aligncenter" width="483"]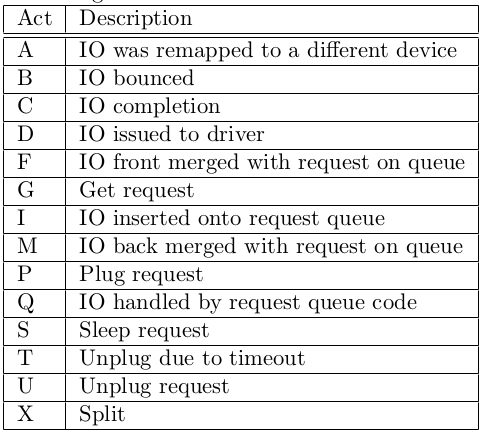
blkparse will parse and format events acquired from blktrace. If you do not want to run blkparse, btrace is a shortcut to generate data out of blktrace and blkparse. Finally we have btt which will analyze data from blktrace and generate time deltas for each layer.
Another tool to grasp before moving on with blktrace is debugfs which is a simple-to-use RAM-based file system specially designed for debugging purposes. It exists as a simple way for kernel developers to make information available to user space. Unlike /proc, which is only meant for information about a process, or sysfs, which has strict one-value-per-file rules, debugfs has no rules at all. Developers can put any information they want there. - lwn.
So the first thing to do is to mount the debugfs file system using the following command:
mount -t debugfs debugfs /sys/kernel/debug
The aim is to allow a kernel developer to make information available in user space. The output of the command below describe how to mount and verify same. You can use the command mount to test if same has been successful. Now that you have the debug file system, you can capture the events.
Diving into the commands
1.So you can use blktrace to trace out the I/O on the machine.
blktrace -d /dev/sda -o -|blkparse -i -
2. At the same time, on another console launch the following command to generate some I/O for testing purpose.
dd if=/dev/zero of=/mnt/test1 bs=1M count=1
From the blktrace console you will get an output which will end up as follows :
CPU0 (8,0):
 Reads Queued:           2,       60KiB Writes Queued:       5,132,   20,524KiB
 Read Dispatches:        2,       60KiB Write Dispatches:       61,   20,524KiB
 Reads Requeued:         0 Writes Requeued:         0
 Reads Completed:        2,       60KiB Writes Completed:       63,   20,524KiB
 Read Merges:            0,        0KiB Write Merges:        5,070,   20,280KiB
 Read depth:             1         Write depth:             7
 IO unplugs:            14         Timer unplugs:           9
Throughput (R/W): 8KiB/s / 2,754KiB/s
Events (8,0): 21,234 entries
Skips: 166 forward (1,940,721 -  98.9%)
3. Same result can also be achieved using the btrace command. Apply the same principle as in part 2 once the command has been launched.
btrace /dev/sda
4. In part 1, 2 and 4 the blktrace commands were launched in such a way that it will run forever - without exiting. In this particular example, I will output the file name for analysis. Assume that you want to run the blktrace for 30 seconds, the command will be as follows:
blktrace -w 30 -d /dev/sda -o io-debugging
5. On another console, launch the following command:
dd if=/dev/sda of=/dev/null bs=1M count=10 iflag=direct
6. Wait for 30 seconds to allow step 4 to be completed. I got the following results just after:
[root@localhost mnt]# blktrace -w 30 -d /dev/sda -o io-debugging
=== sda ===
  CPU  0:                  510 events,       24 KiB data
  Total:                   510 events (dropped 0),       24 KiB data
7. You will notice at the directory /mnt the file will be created. To read it use the command blkparse.
blkparse io-debugging.blktrace.0 | less
8. Now let's see a simple extract from the blkparse command:
8,0    0        1     0.000000000  5686  Q   R 0 + 1024 [dd]
8,0    0        0     0.000028926     0  m   N cfq5686S / alloced
8,0    0        2     0.000029869  5686  G   R 0 + 1024 [dd]
8,0    0        3     0.000034500  5686  P   N [dd]
8,0    0        4     0.000036509  5686  I   R 0 + 1024 [dd]
8,0    0        0     0.000038209     0  m   N cfq5686S / insert_request
8,0    0        0     0.000039472     0  m   N cfq5686S / add_to_rr
The first column shows the device major,minor tuple, the second column gives information about the CPU and it goes on with the sequence, the timestamps, PID of the process issuing the IO process. The 6th column shows the event type, e.g. 'Q' means IO handled by request queue code. Please refer to above diagram for more info. The 7th column is R for Read, W for Write, D for block, B for Barrier operation and finally the last one is the block number and a following + number is the number of blocks requested. The final field between the [ ] brackets is the process name of the process issuing the request. In our case, I am running the command dd.
9.The output can be also analyzed using btt command. You will get almost the same information.
btt -i io-debugging.blktrace.0
Some interesting information here is D2C means the amount of time the IO has been spending into the device whilst Q2C means the total time take as there might be different IO concurrent.
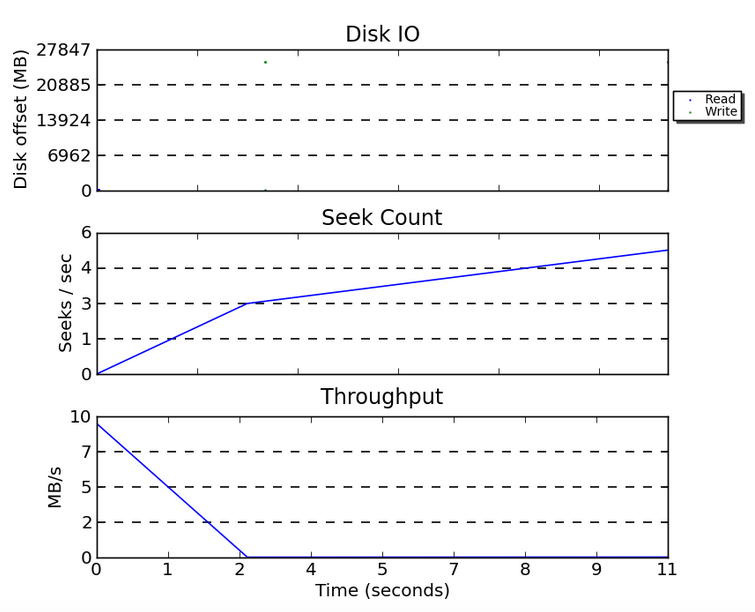
A graphical user interface to makes life easier
The Seekwatcher program generates graphs from blktrace runs to help visualize IO patterns and performance. It can plot multiple blktrace runs together, making it easy to compare the differences between different benchmark runs. You should install the seekwatcher package if you need to visualize detailed information about IO patterns.
The command to be used to generate a picture to for analysis is as follows where seek.png is the output of the png name given.
seekwatcher -t io-debugging.blktrace.0 -o seek.png
What is also interesting is that you can create a movie-like with seekwatch to view the graph.
seekwatcher -t io-debugging.blktrace.0 -o seekmoving.mpg --movie
Tips:
- For the debugfs, you can also edit the /etc/fstab file to make the mount point permanently.

- By default, blktrace will capture all events. This can be limited with the argument -a.
- In case you want to capture persistently for a long time or for a certain amount of time, then use the argument -w.
- blktrace will also stored the extracted data in local directory with a format device.blktrace.cpu, for example sda1.blktrace.cpu.
- At step 1 and 2, you will need to fire a CTRL +C to stop the blktrace.
- As seen in part 2, you have created test test1 file, do delete it same may consume disk space on your machine.
- On part 5, the size of the file created in the /mnt will not exceeds more that 1M since same has been specified in the command.
- At part 9, you will noticed several other information which can be helpful such as D2C and Q2C.
- Q2D latency - time from request submission to Device.
- D2C latency - Device latency for processing request.
- Q2C latency - total latency , Q2D + D2C = Q2C.
- To be able to generate the movie, you will have to install mencoder with all its dependencies.